Course: Information Visualisation, winter 2016
Visual concept and data preparation: I Hong Cheng
Interactivity and Prototype: Kang Zheng Oo
Tutor: Prof. Marian Dörk
Data visualisation as a method to reveal family structure.
In this project we would like to provide a platform to look at the statistic data on this topic in a visual and interactive way.
Design Process
1. Data collection
We collected statistic data about different family types in Germany and chose the ones which would be suitable for our visualisation.
Data source :
Stief- und Patchworkfamilien in Deutschland Bundesministerium für Familie, Senioren, Frauen und Jugend link
Population in families/living arrangements: Former territory of the Federal Republic /New Länder, years, living arrangements link
Anzahl der Alleinerziehenden in Deutschland nach Geschlecht von 2000 bis 2015 link
2. Visual representation
After observing the statistics and some relevant reports on family structure, we can see that there is a diversity of family types nowadays in Germany regarding different forms of partnership and parenthood. “Patchwork family” is a term generally used for the most complex family type. We took the meaning of patchwork literally and developed the visual concept for our visualization.
Draft:
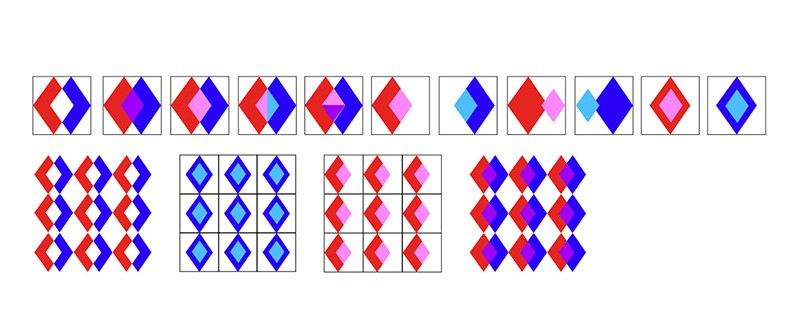
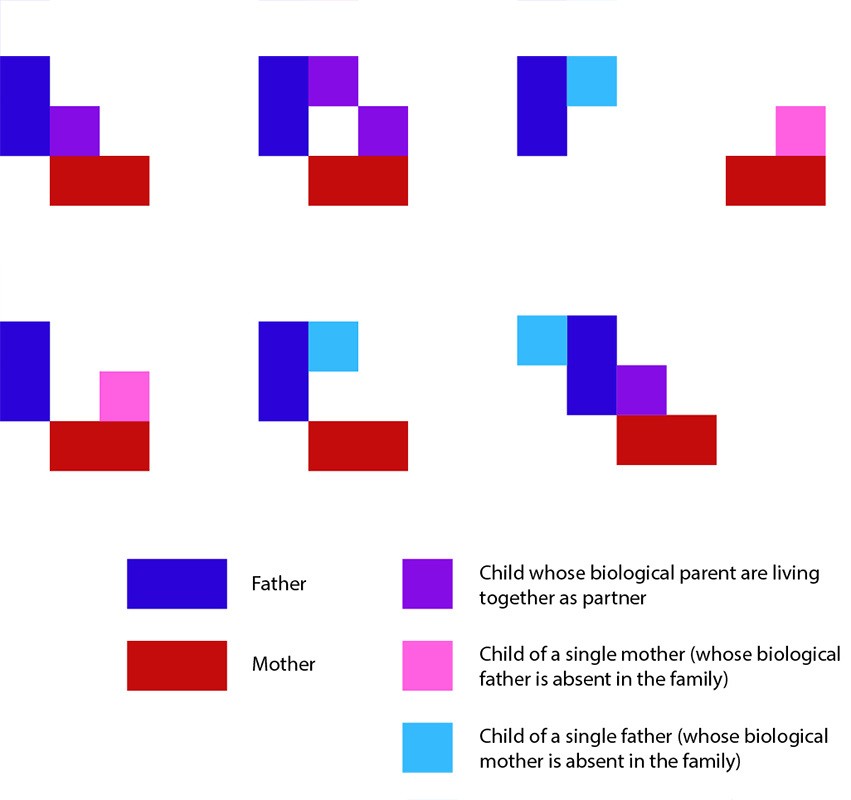
Family patterns are built with rectangles/triangles in different colors, which also represent family members and their relationship. Each family type (its pattern) will represent the amount in the visualization.
To develop patterns of different shapes that can deliver the family members and the quantity.


Challenge
• Create a meaningful context for the visualization which would make the best use of the “patchwork” character and reveal patterns and relations in the data itself.
• Create meaningful interaction for the user to explore the visualization.
• Find the dataset which perfectly meets our initial topic setting.
Prototype
A web-based prototype was created to provide interactivity for users to explore the statistic data in the format of
Demo gif