
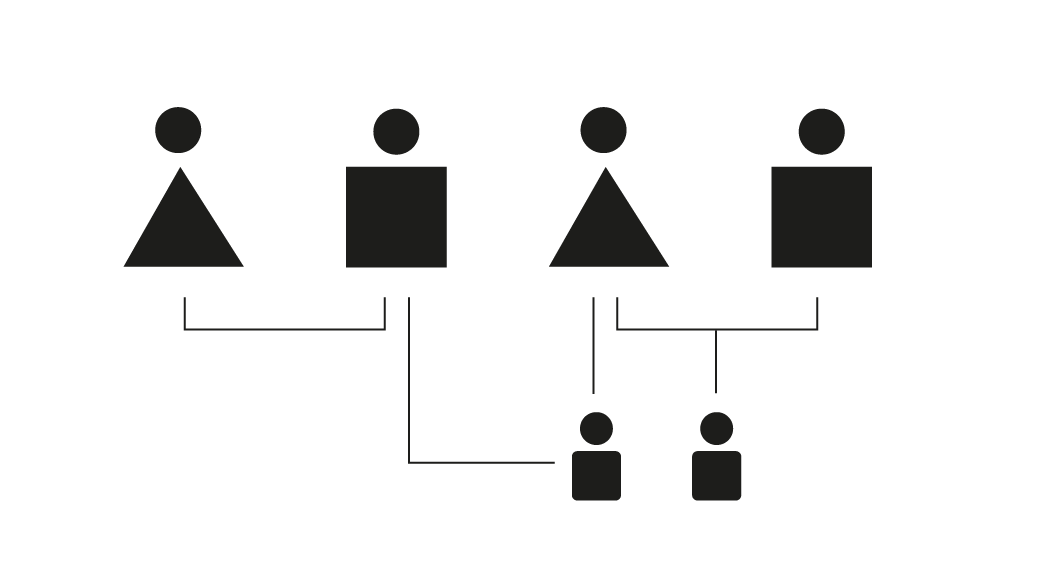
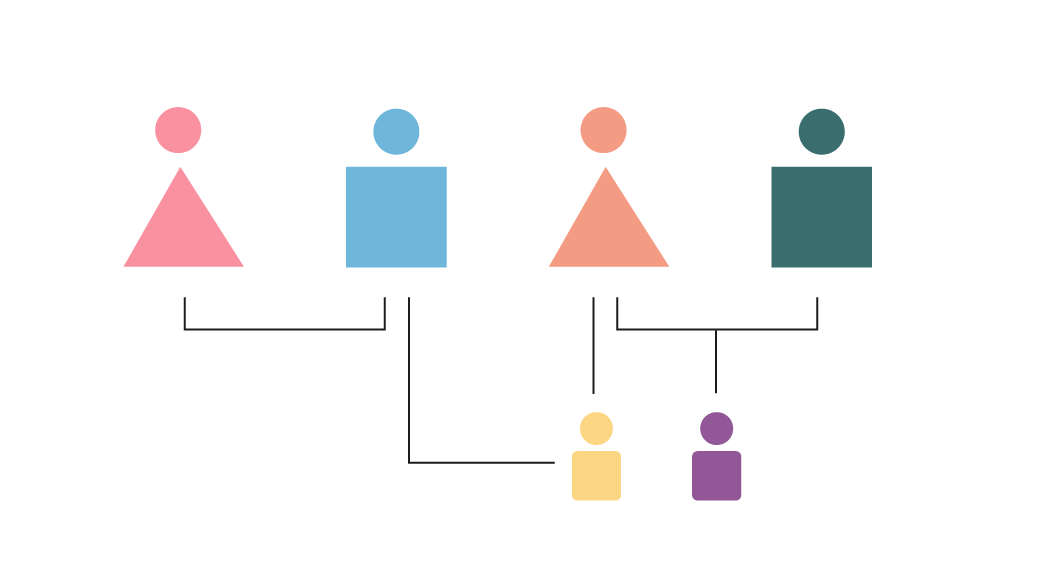
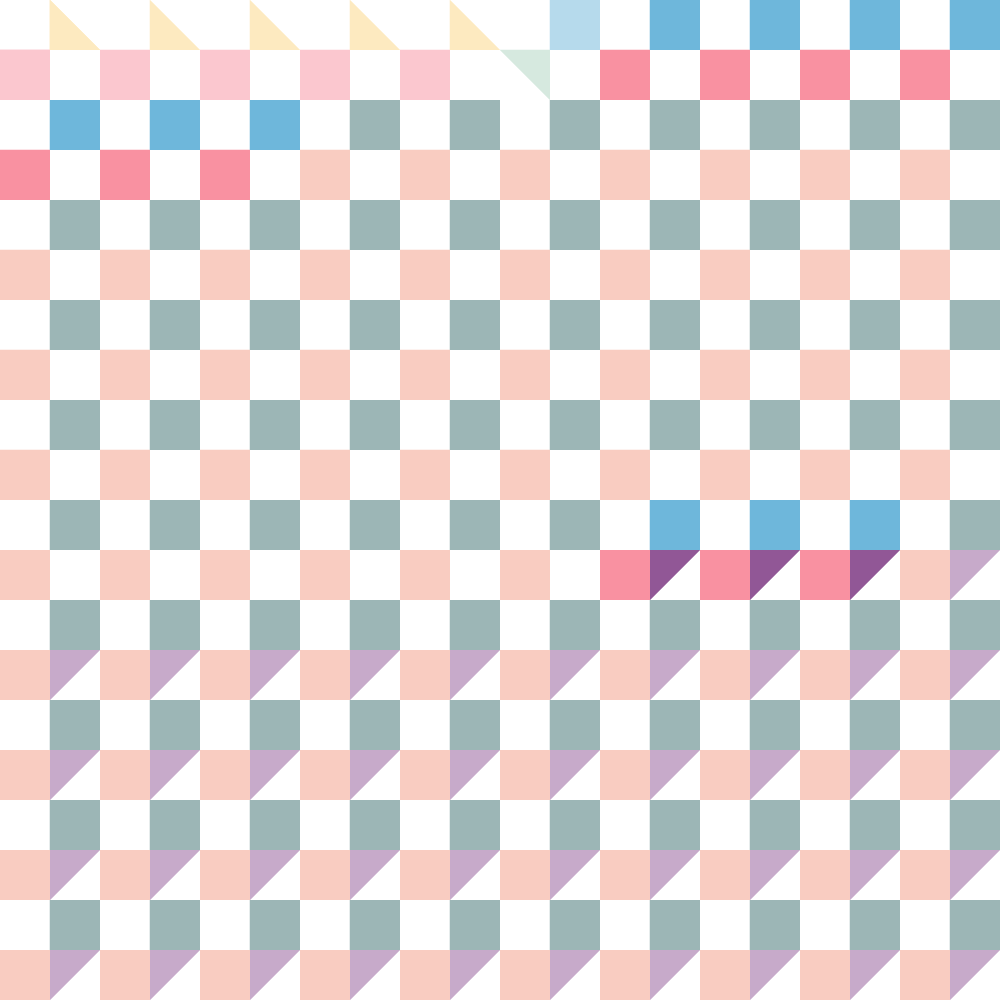
Information visualisation is a powerful way to communicate abstract data. With its interactivity, user can explore the information space and discover relations and patterns. The topic itself is pictorial enough that we could come up with the visual concept very quickly at the beginning : Patchwork family. We have been striving for a meaningful way to present our dataset. We encountered challenges i.e.. putting different family pattern (composed by geometric components) in volume to present quantity and make the collective patterns readable and analysable. And we had to compromised on the time when it came to the data scope. We could not find a dataset which meet our intention (different type of family in 2015). In the end we used an earlier dataset to demonstrate our concept in the Overview section. We apply another interactivity and presentation for the dataset with broader time frame in the Comparison and Timeline section.
We hope that this platform would stir up interest to explore and user would find it helpful to gain insight from the data visualisation. As evaluation, we would like to know more about user behaviour on this site. Please feel free to give us some feedback and feel free to share this site around.